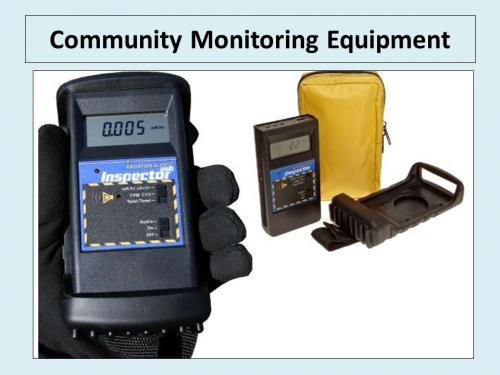
Hi Everyone: The Monitor’s are up and running.
Attached is the information on how to access [Click here] NETC Information at NETC.com
You will be asked for a log-in ID and Password. This information is on page four [4] of the attachment and the access is free. Page 3 explains what NETC is as does page 4 which also shows you that when you click on the Radiation symbol for our monitors in Spanish Village and St. Charles the High, Average and Low readings – You can also click the link for data charts to see weekly, monthly and yearly High, Average and Low readings.
To access the Maps page click on the Yellow Triangle at the top of the page. You can see this triangle on pages 2 and 5.
Included are images and information on a 3rd monitor located at S.Grand and hwy 44. This is the EPA’s monitor. You will be able to the High, Average and Low readings when you click on the icon. You will not however be able to see the historical data for this monitor or any other monitor in the world unless you pay a fee of $19.95.
Page 6 shows the Data Charts from the Spanish Village and from the EPA’s monitors to give you an idea of what you will see for all other sites besides Spanish Village and St. Charles. You will notice that the data from Spanish Village has 3 data lines – Red – Blue and Green, while the EPA only has one data line that is Blue.
The reason for this is that the Community Monitors are reading all Alpha, Beta and Gamma readings, while the EPA and other sites around the world are only reading Gamma signal. The Red line is for High readings; Blue line is for an Average [which takes up to 3 months for a baseline average reading to be established and finally the Green line is for the low readings. The data takes the high and low readings to obtain the average reading.
If you notice there was a spike on July 14th on the Spanish Village data on page 6. This reading was taken at 2:00 pm and there was a heavy downpour of rain. This rain created an umbrella of sorts over the landfill and this was more than likely Radon which then dissipated once the rain stopped. If you look at the EPA’s data for about 2:20 pm, there was a spike – the rain was now over the EPA’s monitor and again was creating a umbrella over that area.
I hope this information and the attached document helps to explain about the readings that you might see. If not, leave your question and we will try to answer it or you can post the question on the NETC message board.
Also, Thank you to State Rep. Bill Otto and Councilman Steve Stenger for the donation of the Monitors and Thank you to Councilman Jerry Grimmer and to Pat Krammer and the International Operating Engineers Local 513 for the donation of the laptops for the Monitors.

