Hello All,
I have had a lot of people ask about BMAC results. I have read through the whole thing (253 pgs) and this is what I would say to you all….. that the best summary to read is on page 9.
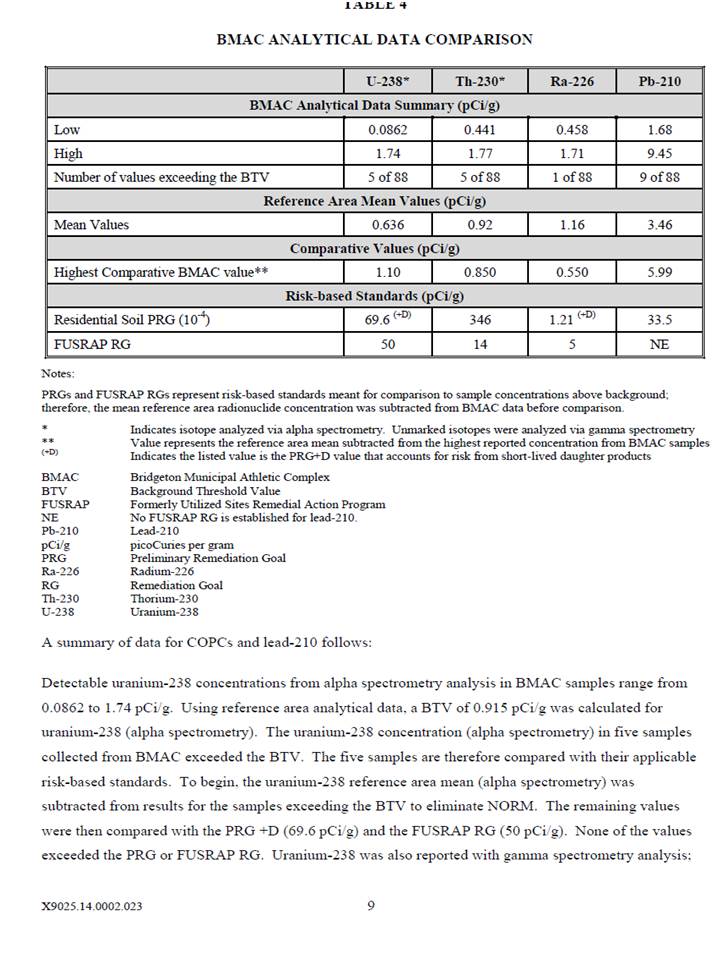
You will see Table 4-BMAC Analytical Data Comparison. The first two rows are a low column and a high column. Look below that at the column that says BTV-Background Threshold Value.
That column will tell you how many samples they found on the BMAC ball field that are above background! For U238 they found 5 out of 88 samples. For Thorium 230 they also found 5 out of 88 samples. Ra 226 was 1 out of 88 samples. Lead 210 is 9 out of 88 samples.
In the case of Lead 210, the EPA results show the SAME level of Lead 210 that our samples showed back in June when we reported them to EPA!
If you have been to all the meetings, then you understand that one of the things we have been talking about is that area where there are radioisotopes present above background, but below remediation levels.
I know its very frustrating and a lot of you have asked “what is safe?” I think the better question is ” at what level is there a risk to human health?” The answer is the higher the level, the more exposure, the greater the risk! And yes, we are exposed to natural radiation everyday…through the sun et….we all know this.
But as parents, we get to decide how many hours our children can play in the sun, and what if any level of sunscreen to put on them. This situation with these BMAC results is not any different.
The purpose of this page and group is to provide FACTS so that you can make your own decisions. Hopefully this post helps you do that. If you have any questions please feel free to message one of us and we will do our best to help you find the answers and provide the documents you need.
Dawn – Just Mom’s STL